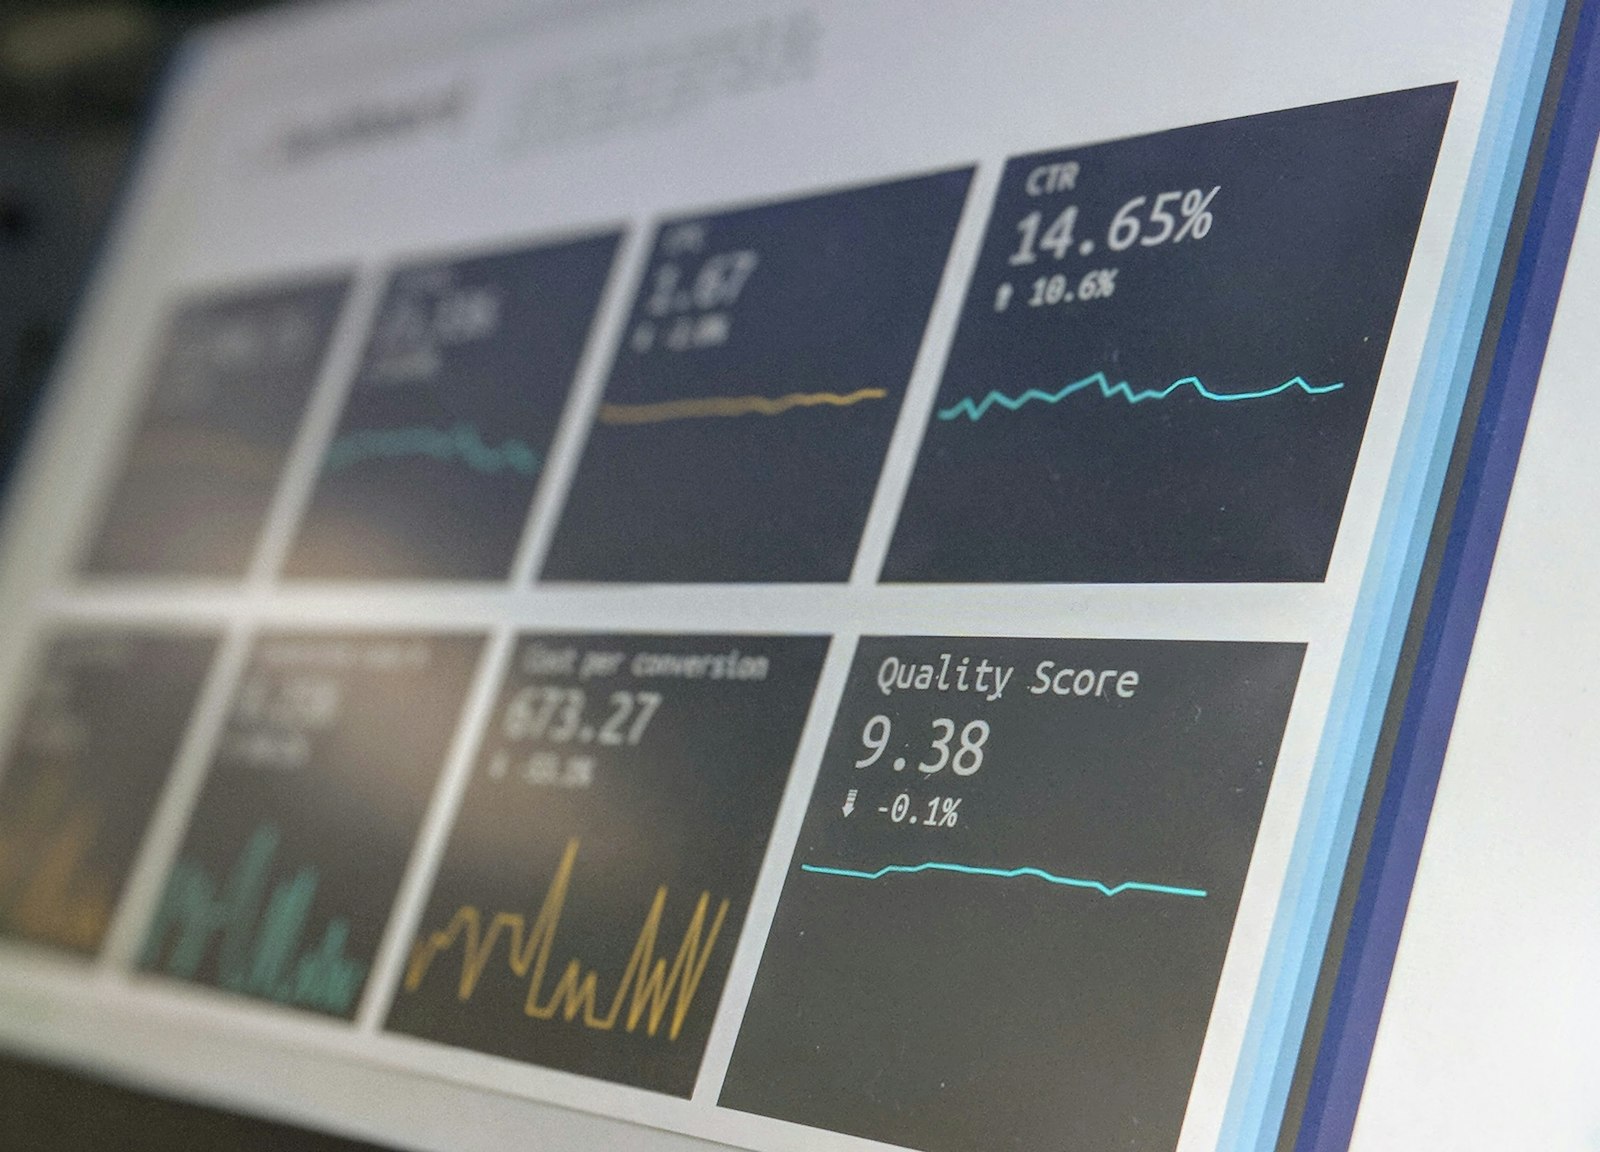
Unified Infrastructure Monitoring Dashboard
An enterprise's IT teams watched FreshService, Zscaler and other tools separately, so outages slipped through. We built one real-time dashboard for the head office, and caught a hidden cost problem along the way.
Overview
A fixed-scope engagement for a large enterprise organization. XLORIT built a centralized infrastructure monitoring dashboard that aggregates health data from multiple enterprise tools into a single real-time display, running live in the client's head office. An AMC engagement continues after delivery.
Outages were being missed because nobody was watching everything at once
The client's IT teams monitored different tools separately: FreshService for incident tickets, Zscaler for network and security alerts, and others independently. When something went down, the information existed, but it was scattered, and issues were missed because no one had a unified view. The client needed one dashboard, visible from the head office, showing the health of all integrated systems in real time across all regions.
- Incident tickets, network health and security alerts lived in separate tools
- No single person had a unified view of system health
- Outages were missed even though the data existed
- The head office needed live visibility across all regions
Our Approach
We built the unified dashboard, and caught a hidden cost problem before it became a crisis.
Catching what enterprise clients don't see, before it becomes a budget problem
A retention change made without the full downstream picture was silently inflating DynamoDB costs across 100,000+ records. We identified it and combined shorter retention with webhook-based event handling: the system still captures everything that matters, it just doesn't hold data longer than necessary. The dashboard runs live in the client's head office, visible to leadership daily, and the architecture is built to add new data sources without rebuilding the core.
- Live in production in the client's head office
- FreshService and Zscaler integrated, with more planned
- 30-second refresh plus real-time webhooks for critical events
- All regions visible from a single head office display
- 100,000+ records managed
- 40% storage cost reduction; retention optimized from 60 to 15 days
Finally, one screen for every region. When something critical happens we see it in real time, not the next morning in a report. It's become the first thing the team looks at every day.
More from XLORIT
More Case Studies

PropTech Revenue Intelligence Platform
Built a multi-integration PropTech SaaS from zero, with a 24x7 multilingual prospect AI agent and a sync layer that unifies AppFolio, Rent Manager and Rentvine data and catches its own failures.

AI-Powered Event Marketplace
An all-in-one event marketplace connecting vendors, planners and customers, where AI search and a vendor copilot had to work reliably in production, not just in demos.

Teams Call Quality AI Analyzer
Every Microsoft Teams call quality complaint meant a support ticket and a manual investigation call. We built an AI monitoring layer that flags real issues before they become tickets.

Indian Grocery Ecommerce Platform
A US online grocery platform for the Indian diaspora had a webview app with no crash visibility and a silent billing flaw. We rebuilt the foundation and shipped native apps on top of it.

Enterprise Appraisal Management System
A multinational agribusiness needed its tea estate and factory worker appraisals off paper and spreadsheets, live before a fixed appraisal cycle just two months away.

B2B Credit Card Payment Platform
An early-stage FinTech startup wanted businesses to pay rent, GST and vendors by credit card. We built the full platform, and proposed the architecture that made it production-safe.
Checking five tools to know if something is down?
Then something is already down and nobody has noticed yet. Let's centralize it.
Book a Call